NFL standings as a publication table
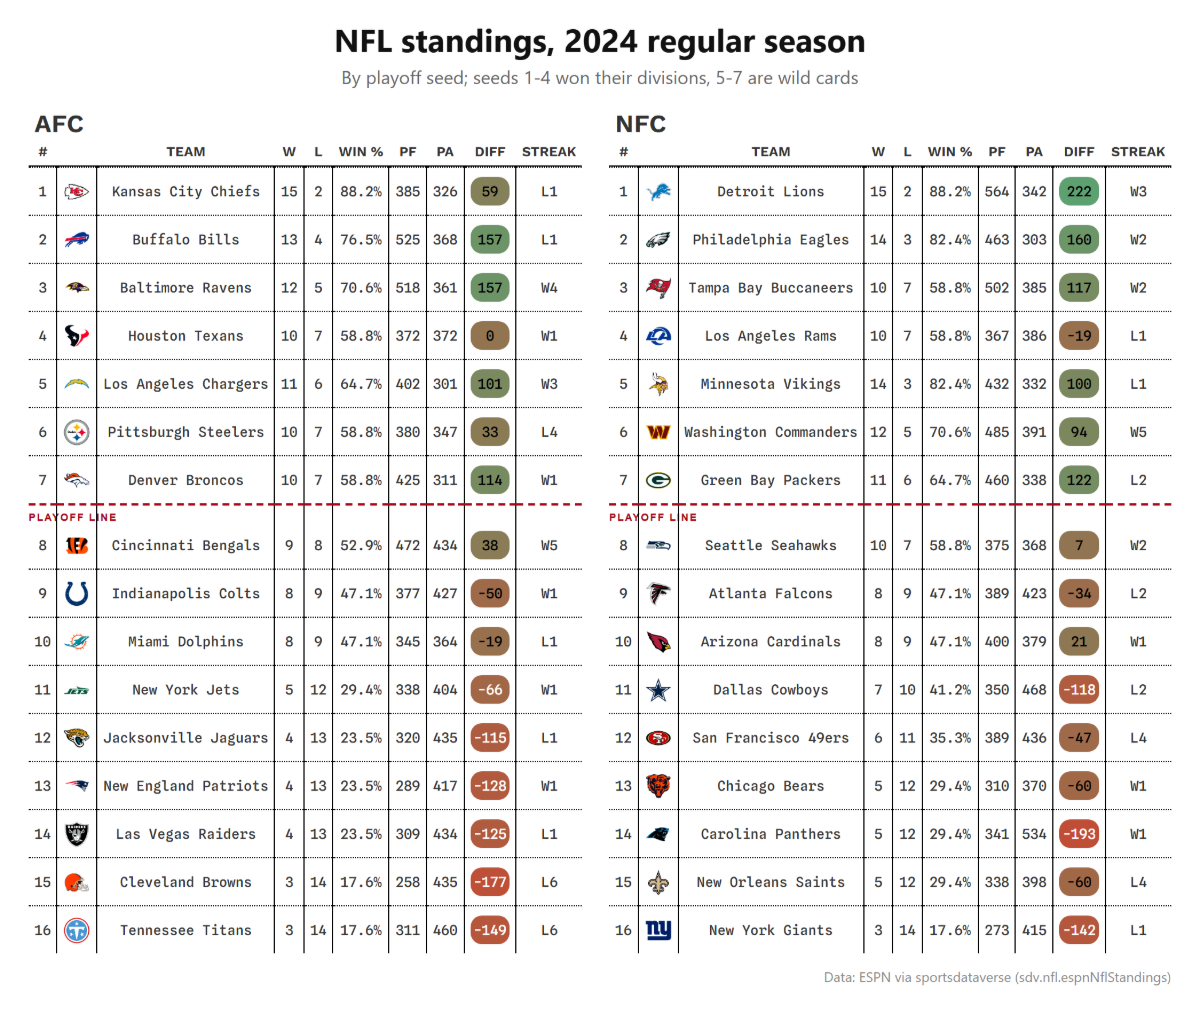
What you'll build: the final 2024 NFL standings as an image ready to post:
one table per conference in seed order, with team logos, record, win
percentage, points for and against, a coloured point differential, the current
streak and a line under the last playoff seed. The two tables sit side by side
under one title and source note. Written to
examples/out/nfl_standings_2024.png.
Needs sportsdataverse ≥ 4.0.0 and @sportsdataverse/* ≥ 0.1.0. Neither is on
npm yet, so build both from source: see the shot chart
tutorial for linking
sdvplot-js. The PNG step also needs playwright and its browser
(npx playwright install chromium).
Sources used
| Source | Host | Call |
|---|---|---|
| ESPN v2 standings | site.api.espn.com/apis/v2/sports/football/nfl/standings?season=2024 | sdv.nfl.espnNflStandings({ season: 2024, parsed: true }) |
@sportsdataverse/sdvtables | (library) | defineTable; /html: prepare; /export: gridTables, htmlToPNG |
@sportsdataverse/sdvplot | (library; bundled index) | logoUrl (the id check) |
Offline fixture: test/fixtures/espn/standings_nfl_2024.json (32 teams, the
final 2024 regular season). The PNG loads each logo from sdvplot's CDN, so that
step needs the network even when the data is offline.
The standings frame
espnNflStandings({ parsed: true }) gives one row per team. Each row has the
conference (group_abbreviation), the ESPN team id, name and abbreviation, and
the season statistics as numbers: wins, losses, ties, win_percent,
playoff_seed, points_for, points_against and a signed streak (+4 is four
straight wins, −1 one loss). ESPN orders each conference by seed, so seeds 1-4
are the division winners and 5-7 the wild cards.
Two things the parsed frame does not carry, and how the script handles them:
- ESPN's clinch letters (
z,y,x,*) are in the raw stat'sdisplayValue. The parsedclincherkeeps the numericvalue, which is 0, so the table marks the playoff field with a cutline instead. - The streak as text. The script writes
W4/L1from the signed number.
Logos by ESPN id
The logo column is keyed on team_id, the ESPN id. Before building the table
the script checks two things. The id has one type (a string, as every sdv-js id
is), and sdvplot resolves each id to the same logo as the team's abbreviation.
It does for all 32 teams, including the two whose ESPN and nflverse
abbreviations differ (WSH / WAS, LAR / LA). A logo keyed on the wrong
id would only show up in the image, so the check is there to fail first.
Building the table
defineTable() takes typed column kinds: c.int for counts, c.pct for the
win share (it multiplies by 100), c.logo('team_id', { league: 'nfl' }) for
the logo, and c.colorPills('diff', { domain: [-225, 225] }) for the point
differential. Giving both tables the same domain keeps their colours
comparable. Without it each table spans its own range, and sdvtables warns
about that. Three more calls finish it:
.cutline(7, { label: ['Playoff line'] })draws the line under the seventh row..theme('athletic')sets the type and rules..title()names the conference.
prepare(spec) loads the NFL logo index before rendering.
gridTables([...], { ncol: 2, title, subtitle, sourceNote }) sets the two
rendered tables side by side in one HTML frame. htmlToPNG(html, { width: 1200 })
then renders it in headless Chromium (playwright), trims the margins and
returns the PNG bytes.
The script
// 96 — Conference standings → a publication table PNG: ESPN NFL standings →
// @sportsdataverse/sdvtables → HTML → PNG (headless Chromium).
//
// Shows: `espnNflStandings({ season: 2024, parsed: true })` (one row per team),
// one `defineTable` spec per conference (team logo by ESPN id, record, win %,
// points, point differential, streak, a cutline under the 7th seed), the two set
// side by side by `gridTables`, and `htmlToPNG` from
// @sportsdataverse/sdvtables/export. Writes examples/out/nfl_standings_2024.png.
// sdvplot-js is UNPUBLISHED (see README.md); the PNG step also needs playwright and
// its browser (`npx playwright install chromium`) and loads the logos over the network.
//
// Sources: ESPN v2 standings — site.api.espn.com/apis/v2/sports/football/nfl/standings?season=2024
// Offline fixture: test/fixtures/espn/standings_nfl_2024.json (32 teams, final 2024 regular season).

import { mkdirSync, writeFileSync } from 'node:fs';
import sdv from 'sportsdataverse';
import { logoUrl } from '@sportsdataverse/sdvplot';
import { defineTable } from '@sportsdataverse/sdvtables';
import { gridTables, htmlToPNG } from '@sportsdataverse/sdvtables/export';
import { prepare } from '@sportsdataverse/sdvtables/html';
import { setup } from './_offline.mjs';
import { printTable, round } from './_util.mjs';

setup();

const standings = await sdv.nfl.espnNflStandings({ season: 2024, parsed: true });

// The logo column is keyed on the ESPN team id: check it is one type, and that sdvplot
// resolves each id to the same logo as the team's abbreviation (it does for all 32).
const idTypes = new Set(standings.map((r) => typeof r.team_id));
if (idTypes.size !== 1 || !idTypes.has('string')) throw new Error(`team_id is not one string type: ${[...idTypes]}`);
for (const r of standings) {
  if ((await logoUrl(r.team_id, 'nfl')) !== (await logoUrl(r.team_abbreviation, 'nfl'))) throw new Error(`logo for ${r.team_id} ≠ ${r.team_abbreviation}`);
}

const rows = standings
  .map((r) => ({
    conference: r.group_abbreviation,
    seed: r.playoff_seed,
    team_id: r.team_id,
    team: r.team_display_name,
    abbr: r.team_abbreviation,
    wins: r.wins,
    losses: r.losses,
    ties: r.ties,
    win_share: r.win_percent,
    pf: r.points_for,
    pa: r.points_against,
    diff: r.points_for - r.points_against,
    // ESPN's streak is signed: +4 = four straight wins, -1 = one loss
    streak: r.streak > 0 ? `W${r.streak}` : `L${-r.streak}`,
  }))
  .sort((a, b) => a.conference.localeCompare(b.conference) || a.seed - b.seed);

const tableFor = (conference) =>
  defineTable()
    .columns((c) => [
      c.int('seed', { label: '#' }),
      c.logo('team_id', { league: 'nfl', label: '', height: 24 }),
      c.text('team', { label: 'Team' }),
      c.int('wins', { label: 'W' }),
      c.int('losses', { label: 'L' }),
      c.pct('win_share', { label: 'Win %', decimals: 1 }),
      c.int('pf', { label: 'PF' }),
      c.int('pa', { label: 'PA' }),
      c.colorPills('diff', { label: 'Diff', domain: [-225, 225] }), // one domain, so AFC and NFC colours compare
      c.text('streak', { label: 'Streak' }),
    ])
    .cutline(7, { label: ['Playoff line'] })
    .theme('athletic')
    .title(conference)
    .build();

const afc = rows.filter((r) => r.conference === 'AFC');
const nfc = rows.filter((r) => r.conference === 'NFC');
const specs = [tableFor('AFC'), tableFor('NFC')];
await Promise.all(specs.map((s) => prepare(s))); // loads the NFL logo shard renderHTML reads
const html = gridTables(
  [
    { spec: specs[0], rows: afc },
    { spec: specs[1], rows: nfc },
  ],
  {
    ncol: 2,
    title: 'NFL standings, 2024 regular season',
    subtitle: 'By playoff seed; seeds 1-4 won their divisions, 5-7 are wild cards',
    sourceNote: 'Data: ESPN via sportsdataverse (sdv.nfl.espnNflStandings)',
  }
);
mkdirSync(new URL('./out/', import.meta.url), { recursive: true });
writeFileSync(new URL('./out/nfl_standings_2024.png', import.meta.url), await htmlToPNG(html, { width: 1200 }));

for (const [name, side] of [['AFC', afc], ['NFC', nfc]]) {
  printTable(
    side.map((r) => ({ seed: r.seed, team: r.abbr, team_id: r.team_id, record: `${r.wins}-${r.losses}${r.ties ? `-${r.ties}` : ''}`, win_pct: round(r.win_share, 3), pf: r.pf, pa: r.pa, diff: r.diff, streak: r.streak })),
    ['seed', 'team', 'team_id', 'record', 'win_pct', 'pf', 'pa', 'diff', 'streak'],
    16,
    `${name} by seed${name === 'NFC' ? ' → examples/out/nfl_standings_2024.png' : ''}`
  );
}
This script imports the unpublished @sportsdataverse/* packages, and its PNG
step drives a local Chromium through playwright. Build sdvplot-js locally and
run it from examples/.
Output
Output of node examples/96_sdvplot_nfl_standings_table.mjs (offline, against the committed fixtures):
## AFC by seed
| seed | team | team_id | record | win_pct | pf  | pa  | diff | streak |
| ---- | ---- | ------- | ------ | ------- | --- | --- | ---- | ------ |
| 1    | KC   | 12      | 15-2   | 0.882   | 385 | 326 | 59   | L1     |
| 2    | BUF  | 2       | 13-4   | 0.765   | 525 | 368 | 157  | L1     |
| 3    | BAL  | 33      | 12-5   | 0.706   | 518 | 361 | 157  | W4     |
| 4    | HOU  | 34      | 10-7   | 0.588   | 372 | 372 | 0    | W1     |
| 5    | LAC  | 24      | 11-6   | 0.647   | 402 | 301 | 101  | W3     |
| 6    | PIT  | 23      | 10-7   | 0.588   | 380 | 347 | 33   | L4     |
| 7    | DEN  | 7       | 10-7   | 0.588   | 425 | 311 | 114  | W1     |
| 8    | CIN  | 4       | 9-8    | 0.529   | 472 | 434 | 38   | W5     |
| 9    | IND  | 11      | 8-9    | 0.471   | 377 | 427 | -50  | W1     |
| 10   | MIA  | 15      | 8-9    | 0.471   | 345 | 364 | -19  | L1     |
| 11   | NYJ  | 20      | 5-12   | 0.294   | 338 | 404 | -66  | W1     |
| 12   | JAX  | 30      | 4-13   | 0.235   | 320 | 435 | -115 | L1     |
| 13   | NE   | 17      | 4-13   | 0.235   | 289 | 417 | -128 | W1     |
| 14   | LV   | 13      | 4-13   | 0.235   | 309 | 434 | -125 | L1     |
| 15   | CLE  | 5       | 3-14   | 0.176   | 258 | 435 | -177 | L6     |
| 16   | TEN  | 10      | 3-14   | 0.176   | 311 | 460 | -149 | L6     |
(16 rows, all shown)

## NFC by seed → examples/out/nfl_standings_2024.png
| seed | team | team_id | record | win_pct | pf  | pa  | diff | streak |
| ---- | ---- | ------- | ------ | ------- | --- | --- | ---- | ------ |
| 1    | DET  | 8       | 15-2   | 0.882   | 564 | 342 | 222  | W3     |
| 2    | PHI  | 21      | 14-3   | 0.824   | 463 | 303 | 160  | W2     |
| 3    | TB   | 27      | 10-7   | 0.588   | 502 | 385 | 117  | W2     |
| 4    | LAR  | 14      | 10-7   | 0.588   | 367 | 386 | -19  | L1     |
| 5    | MIN  | 16      | 14-3   | 0.824   | 432 | 332 | 100  | L1     |
| 6    | WSH  | 28      | 12-5   | 0.706   | 485 | 391 | 94   | W5     |
| 7    | GB   | 9       | 11-6   | 0.647   | 460 | 338 | 122  | L2     |
| 8    | SEA  | 26      | 10-7   | 0.588   | 375 | 368 | 7    | W2     |
| 9    | ATL  | 1       | 8-9    | 0.471   | 389 | 423 | -34  | L2     |
| 10   | ARI  | 22      | 8-9    | 0.471   | 400 | 379 | 21   | W1     |
| 11   | DAL  | 6       | 7-10   | 0.412   | 350 | 468 | -118 | L2     |
| 12   | SF   | 25      | 6-11   | 0.353   | 389 | 436 | -47  | L4     |
| 13   | CHI  | 3       | 5-12   | 0.294   | 310 | 370 | -60  | W1     |
| 14   | CAR  | 29      | 5-12   | 0.294   | 341 | 534 | -193 | W1     |
| 15   | NO   | 18      | 5-12   | 0.294   | 338 | 398 | -60  | L4     |
| 16   | NYG  | 19      | 3-14   | 0.176   | 273 | 415 | -142 | L1     |
(16 rows, all shown)
What it shows
The two top seeds went 15-2, but by different routes. Detroit outscored opponents by 222 points, the most in the league. Kansas City's 15 wins came with a differential of +59, smaller than those of four AFC teams seeded below it: Buffalo and Baltimore (+157 each), Denver (+114) and the Chargers (+101).
The table shows the cost of a division title in the NFC. Minnesota went 14-3 and is the fifth seed, a wild card behind Detroit in the NFC North, while the Rams won the NFC West at 10-7 with a −19 differential and are seeded fourth. Seattle finished 10-7 too, with a positive differential, and missed the playoffs. Cincinnati (9-8, +38) is the AFC's team just under the line.
Variations
- Other leagues:
espnNbaStandingsorespnNhlStandingshave the same shape; change the logo column'sleague. - One table: drop
gridTablesand pass a single spec totableToPNG(spec, rows). - A social image:
socialCrop(spec, rows, { aspect: '4:5' })puts the trimmed table on a fixed-ratio canvas. - Another look: any name in
THEMES(broadsheet,swiss,midnight, …).
Work through it live
- sdvplot-js tables guide, table themes and exporting PNGs.
- The sdvplot-js tables notebook renders the same kinds of table in the browser.
Next steps
- Roster table with headshots: an HTML table built by hand from sdvplot's URLs.
- A player's form from his game log: Plot in Node to PNG.