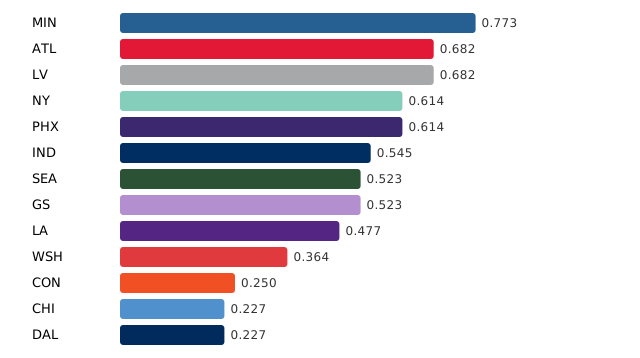
Standings bars in team colours
What you'll build: a horizontal bar chart of WNBA win percentage, one bar
per team in its primary colour with the team logo at the left — a plain SVG
assembled from sdvplot colours and URLs, written to
examples/out/standings.svg.
Sources used
| Source | Host | Call |
|---|---|---|
| ESPN Site API (v2 standings) | site.api.espn.com/apis/v2/sports/basketball/wnba/standings?season=2025 | sdv.wnba.espnWnbaStandings({ season: 2025 }) |
@sportsdataverse/sdvplot | (library; bundled index, no network) | palette('wnba', ids), logoUrl(id, 'wnba'), onColor(hex) |
Offline fixture: test/fixtures/espn/standings_wnba_2025.json (captured
2026-10-06). sdvplot-js is unpublished — see the
shot chart tutorial for how to build and link it.
Resolving teams by ESPN id
sdvplot resolves a team from many id systems (team_id, ESPN id, ESPN
abbreviation, NBA API id, nflverse / MLBAM / NHL ids, …) with idSystem: 'auto' by default. For the WNBA, as for the NBA, the canonical team_id in
its index is the ESPN id, so the team_id strings the standings parser
emits resolve directly — no abbreviation mapping, no name matching.
palette(league, teams)returns an object keyed by whatever you passed (String(input)), socolors[r.team_id]looks up a row's colour. Withteamsomitted it returns every team keyed by abbreviation.logoUrl(team, league, { season?, variant?, markType? })returns the CDN URL of the current primary mark (asdv.nyc3.cdn.digitaloceanspaces.comcontent-addressed PNG). It is a string; nothing is fetched, which is why the script runs offline. The SVG's<image href>loads it when viewed.onColor(hex)picks black or white text for a background — the script shows it in the table (text_on) and you would use it for labels drawn on the bars.
teamColors(league, teams, { which }) is the array-returning sibling, and
headshotUrl the player equivalent (next tutorial).
Drawing without a chart library
The chart is twelve lines of template string: for each team a logo <image>,
an abbreviation <text>, a <rect> whose width is win_pct × usable width,
and the value as text. The point of the tutorial is the data side — getting a
correct colour and logo for every row from an id you already hold — rather
than the plotting; drop the same colors map into D3, Observable Plot, or a
<canvas> and it works the same way.
The script
// 91 — Standings bar chart: ESPN WNBA standings → horizontal bars in team colours.
//
// Shows: @sportsdataverse/sdvplot `palette` (team → hex, keyed by whatever you
// passed — here ESPN team ids) and `logoUrl` (a CDN URL string, no fetch) laid
// out as a plain SVG. Written to examples/out/standings.svg. The packages are
// UNPUBLISHED (see README.md); colours come from sdvplot's bundled index, so
// this runs offline.
//
// Sources: ESPN Site API v2 — site.api.espn.com/apis/v2/sports/basketball/wnba/standings?season=2025
// Offline fixture: test/fixtures/espn/standings_wnba_2025.json (captured 2026-10-06).
import { mkdirSync, writeFileSync } from 'node:fs';
import sdv from 'sportsdataverse';
import { palette, logoUrl, onColor } from '@sportsdataverse/sdvplot';
import { setup } from './_offline.mjs';
import { printTable, round } from './_util.mjs';
setup();
const rows = (await sdv.wnba.espnWnbaStandings({ season: 2025, parsed: true })).sort((a, b) => b.win_percent - a.win_percent);
const ids = rows.map((r) => r.team_id);
const colors = await palette('wnba', ids);
const logos = Object.fromEntries(await Promise.all(ids.map(async (id) => [id, await logoUrl(id, 'wnba')])));
const table = rows.map((r) => ({ team: r.team_abbreviation, team_id: r.team_id, win_pct: round(r.win_percent, 3), color: colors[r.team_id], text_on: onColor(colors[r.team_id]), logo: logos[r.team_id] }));
printTable(table, ['team', 'team_id', 'win_pct', 'color', 'text_on', 'logo'], 6, 'Team colours + logo URLs resolved by ESPN id');
// Horizontal bar chart: one row per team, bar length = win%, logo at the left.
const ROW = 26;
const LEFT = 120;
const W = 640;
const H = 20 + rows.length * ROW;
const esc = (s) => String(s).replace(/&/g, '&').replace(/</g, '<').replace(/"/g, '"');
const bars = table
.map((t, i) => {
const y = 10 + i * ROW;
const len = (W - LEFT - 60) * t.win_pct;
return (
`<image href="${esc(t.logo)}" x="4" y="${y + 2}" width="22" height="22"/>` +
`<text x="32" y="${y + 17}" font-family="sans-serif" font-size="13">${esc(t.team)}</text>` +
`<rect x="${LEFT}" y="${y + 3}" width="${len.toFixed(1)}" height="${ROW - 6}" fill="${t.color}" rx="3"/>` +
`<text x="${LEFT + len + 6}" y="${y + 17}" font-family="sans-serif" font-size="12" fill="#333">${t.win_pct.toFixed(3)}</text>`
);
})
.join('\n');
const svg = `<svg xmlns="http://www.w3.org/2000/svg" xmlns:xlink="http://www.w3.org/1999/xlink" viewBox="0 0 ${W} ${H}" width="${W}" height="${H}">\n<rect width="${W}" height="${H}" fill="#fff"/>\n${bars}\n</svg>\n`;
mkdirSync(new URL('./out/', import.meta.url), { recursive: true });
writeFileSync(new URL('./out/standings.svg', import.meta.url), svg);
console.log(`wrote examples/out/standings.svg (${rows.length} bars)`);
This script imports @sportsdataverse/sdvplot / @sportsdataverse/sporty, which are not published to npm yet, so a sandbox cannot install them. Build sdvplot-js locally as described above and run it from examples/.
Output
Output of node examples/91_sdvplot_standings_colors.mjs (offline, against the committed fixtures):
## Team colours + logo URLs resolved by ESPN id
| team | team_id | win_pct | color   | text_on | logo                       |
| ---- | ------- | ------- | ------- | ------- | -------------------------- |
| MIN  | 8       | 0.773   | #266092 | #ffffff | https://sdv.nyc3.cdn.digi… |
| ATL  | 20      | 0.682   | #e31837 | #ffffff | https://sdv.nyc3.cdn.digi… |
| LV   | 17      | 0.682   | #a7a8aa | #000000 | https://sdv.nyc3.cdn.digi… |
| NY   | 9       | 0.614   | #86cebc | #000000 | https://sdv.nyc3.cdn.digi… |
| PHX  | 11      | 0.614   | #3c286e | #ffffff | https://sdv.nyc3.cdn.digi… |
| IND  | 5       | 0.545   | #002d62 | #ffffff | https://sdv.nyc3.cdn.digi… |
(13 rows, first 6 shown)
wrote examples/out/standings.svg (13 bars)
Variations
palette('nba', ids, { which: 'secondary' })for alternate colours;mix/solid/contrastare there for building readable palettes.logoUrl(id, 'nfl', { season: 2015 })returns the mark that was current in that season (relocations and rebrands are in the index).- The React subpath (
@sportsdataverse/sdvplot/react) exportsTeamLogo,Wordmark,Headshotand auseTeamColorshook for the same data.
Next steps
- Roster table with headshots —
headshotUrl. - WNBA standings — the table behind the bars.