Weekly power-rankings ladder, posted by a GitHub Action
What you'll build: the AP Top 25 as a 25-rung ladder (rank, movement since last week, logo, team, record, first-place votes, and a bar of poll points in the team's colour), rendered to a 1080 × 1350 PNG. A workflow refreshes it every Tuesday of the season. Writers and team accounts post this graphic every week.
This needs sportsdataverse ≥ 4.0.0 and @sportsdataverse/sdvplot ≥ 0.1.0
(plot.sportsdataverse.org). Neither is on npm
yet: until they are, run the script from this repo against a local sdvplot-js
build, as described in the shot chart tutorial.
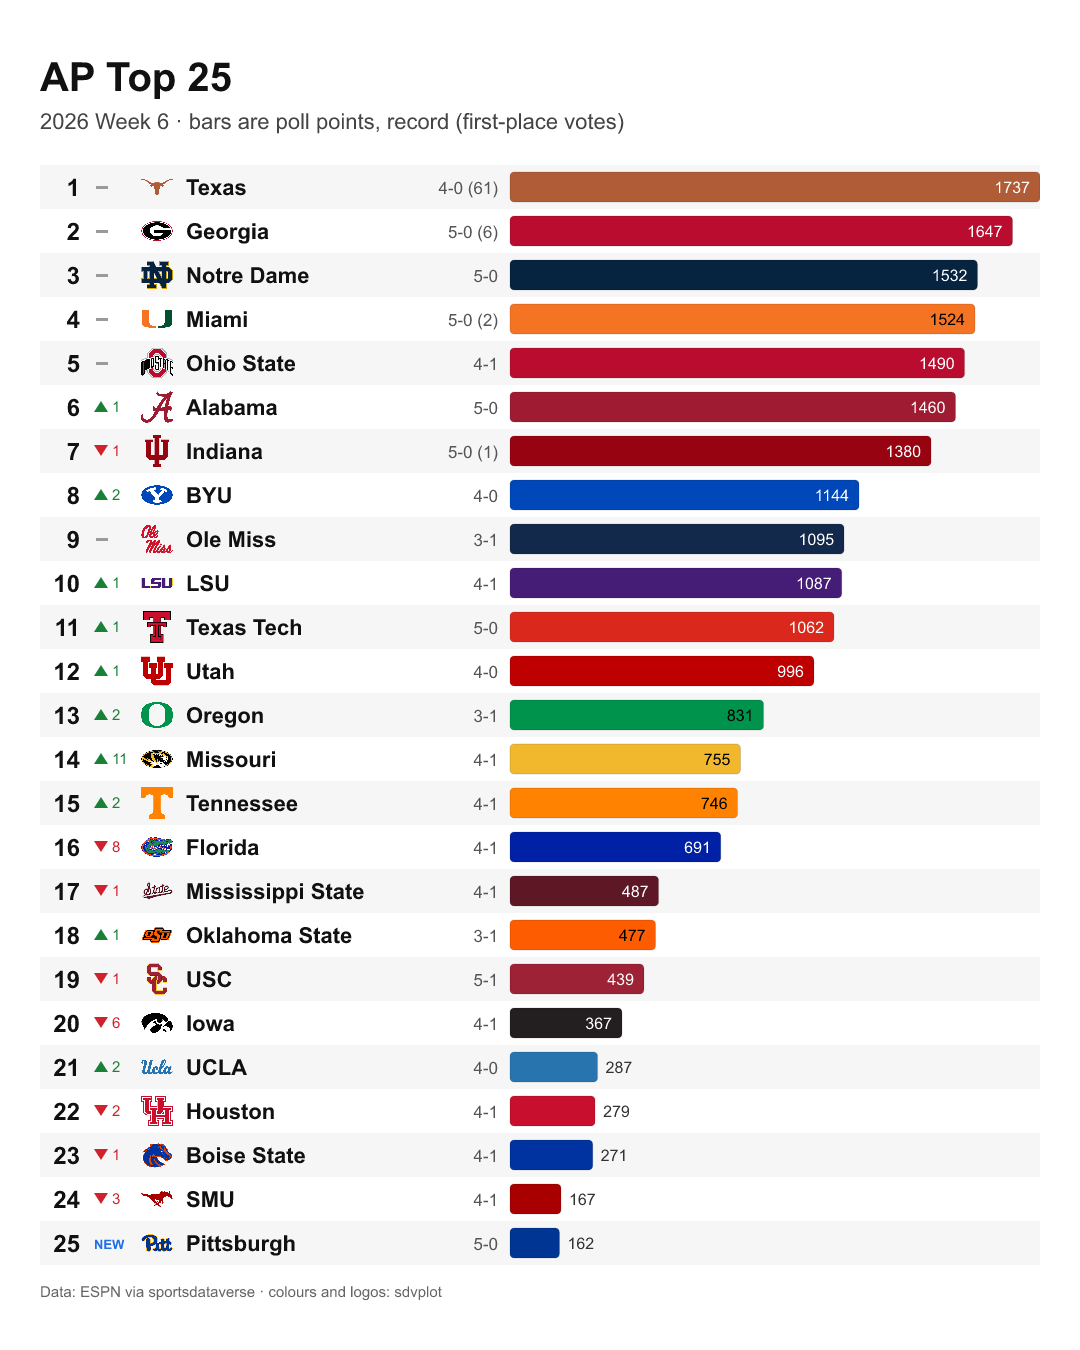
This ladder is a real run against live ESPN data on 2026-10-08, with no arguments, which gave ESPN's current poll: the 2026 Week 6 AP Top 25, released 2026-10-04.
Sources used
| Source | Host | Call |
|---|---|---|
| ESPN CDN (the espn.com rankings page data) | cdn.espn.com/core/college-football/rankings?xhr=1[&year=&week=] | sdv.cfb.espnCfbCdnRankings({ season?, week? }) |
sportsdataverse/parsers | (library) | parseEndpoint('espn', 'cdn_rankings', raw), the parser that parsed: true runs |
@sportsdataverse/sdvplot | (library; bundled team index, no network) | palette('cfb', ids, { idSystem: 'espn' }), logoUrl, onColor |
@sportsdataverse/sdvplot/export | (library) + the logo CDN | socialCard(svg, { aspect: '4:5' }), toPNG(svg, { width: 1080 }) |
Offline fixture: test/fixtures/espn/cdn/rankings_cfb.json.gz (2024 week 5),
the same capture the rankings and drives tutorial uses.
How the script works
One request, two uses. The script fetches the raw rankings page once,
then parses it with parseEndpoint('espn', 'cdn_rankings', raw), the same
parser that { parsed: true } would run. It keeps the raw payload because the
parsed rows (one per poll entry: poll_name, rank, previous_rank, team_id,
team_display_name, formatted_record, points, first_place_votes) don't
say which week they are. The raw page does, in
content.config.json.requestedSeason, so the title shows the week ESPN
actually served, not the week the script asked for.
Which poll and week. By default the script uses ESPN's current week and the
AP Top 25. POLL=AFCA Coaches Poll switches poll. SEASON=2025 WEEK=10
draws a past regular-season poll. ESPN always serves some poll, the last one
in the off-season, so a poll name that matches no rows is a mistake. The
script then exits with status 1, which fails the scheduled run where you will
see it.
Movement. previous_rank - rank gives the arrows (up green, down red, a
dash for no change). previous_rank is 0 for a team unranked last week, and
the ladder marks it NEW. ESPN's own trend column agreed with this on every
ranked team of the Week 6 poll but one: Pittsburgh, unranked in Week 5 (52
points among the teams receiving votes), which ESPN's trend marks +1 and
the ladder marks NEW.
Drawing. The ladder is a plain SVG. The bars are scaled to the top team's
points, are filled with the team colour from palette('cfb', …) and have a
faint outline, so a white or yellow colour still shows. The points are written
inside the bar in onColor when it is long enough, and after it otherwise.
socialCard frames it 4:5 and toPNG rasterizes it, downloading the logos
(see the scores card for fonts and the offline mode,
which are the same here).
The script
// 95 — Weekly power-rankings ladder: the AP Top 25 → a team-coloured ladder PNG, built for a weekly GitHub Action.
//
// Shows: `espnCfbCdnRankings()` parsed by `parseEndpoint('espn', 'cdn_rankings', raw)` (one row per
// poll entry, every poll), filtered
// to one poll and drawn as a 25-rung ladder: rank, movement since last week, logo, team,
// record, and a bar of poll points in the team's colour. Colours and logos come from
// @sportsdataverse/sdvplot `palette` / `logoUrl` by ESPN team id, bar labels from `onColor`;
// `socialCard` frames it 4:5 and `toPNG` (optional peer @resvg/resvg-js) rasterizes it,
// downloading the logos. Writes out/rankings_ladder.png + rankings_ladder.json next to this script.
//
// Inputs (env): POLL = AP Top 25 (default) | AFCA Coaches Poll | … (the `poll_name` column)
// SEASON, WEEK = a past poll (regular season); default: ESPN's current week
// SDV_LIVE=1 hits the real hosts (ESPN + the logo CDN); the repo's docs build runs it
// offline against the committed fixture instead (examples/_offline.mjs, logos skipped).
// The workflow template is examples/workflows/rankings-ladder.yml.
//
// Sources: ESPN CDN — cdn.espn.com/core/college-football/rankings?xhr=1[&year=SEASON&week=WEEK]
// Offline fixture: test/fixtures/espn/cdn/rankings_cfb.json.gz (2024 week 5).
import { mkdirSync, writeFileSync } from 'node:fs';
import sdv from 'sportsdataverse';
import { parseEndpoint } from 'sportsdataverse/parsers';
import { logoUrl, onColor, palette } from '@sportsdataverse/sdvplot';
import { socialCard, toPNG } from '@sportsdataverse/sdvplot/export';
const LIVE = process.env.SDV_LIVE === '1';
if (!LIVE) await import('./_offline.mjs').then((m) => m.setup()); // repo-only: serve committed fixtures
const POLL = process.env.POLL || 'AP Top 25';
const args = {};
if (process.env.SEASON) args.season = Number(process.env.SEASON);
if (process.env.WEEK) Object.assign(args, { week: Number(process.env.WEEK), season_type: 2 });
// One request: keep the raw page (for the week label below) and parse it with the same parser `parsed: true` uses.
const raw = await sdv.cfb.espnCfbCdnRankings(args);
const parsed = parseEndpoint('espn', 'cdn_rankings', raw);
const ranked = parsed.filter((r) => r.poll_name === POLL && r.ranked === true).sort((a, b) => a.rank - b.rank);
if (ranked.length === 0) {
// ESPN always serves some poll (the last one, off-season), so no rows means a wrong POLL or a changed payload: fail the run.
console.error(`no "${POLL}" ranks for ${JSON.stringify(args)}; polls present: ${[...new Set(parsed.map((r) => r.poll_name))].join(' | ')}`);
process.exit(1);
}
// The week ESPN actually served, from the page's own config (absent in the trimmed offline fixture).
const served = raw?.content?.config?.json?.requestedSeason;
const week = served ? `${served.year} ${served.week?.displayValue ?? ''}`.trim() : args.week ? `${args.season ?? ''} Week ${args.week}`.trim() : '';
const ids = ranked.map((r) => r.team_id);
const colors = await palette('cfb', ids, { idSystem: 'espn' });
const logos = Object.fromEntries(await Promise.all(ids.map(async (id) => [id, (await logoUrl(id, 'cfb', { idSystem: 'espn' })) ?? null])));
const rows = ranked.map((r) => ({
rank: r.rank,
// previous_rank 0 = unranked last week
move: r.previous_rank > 0 ? r.previous_rank - r.rank : null,
team: r.team_display_name,
abbr: r.team_abbreviation,
record: r.formatted_record,
points: r.points,
first: r.first_place_votes,
color: colors[r.team_id] ?? '#777777',
logo: logos[r.team_id] ?? r.team_logo,
}));
console.log(`## ${POLL}${week ? `, ${week}` : ''}`);
console.log('| rank | move | team | record | points | 1st | colour |');
console.log('| --- | --- | --- | --- | --- | --- | --- |');
for (const r of rows) {
console.log(`| ${r.rank} | ${r.move === null ? 'new' : r.move} | ${r.team} | ${r.record} | ${r.points} | ${r.first || ''} | ${r.color} |`);
}
// --- The ladder: a plain SVG, one rung per team. ---
const FONT = "font-family=\"'DejaVu Sans', 'Liberation Sans', Arial, Helvetica, sans-serif\"";
const esc = (s) => String(s).replace(/&/g, '&').replace(/</g, '<').replace(/"/g, '"');
const W = 1000;
const RUNG = 44;
const TOP = 120;
const BAR_X = 470;
const BAR_W = W - BAR_X;
const H = TOP + rows.length * RUNG + 40;
const maxPoints = Math.max(...rows.map((r) => r.points || 0)) || 1;
// Text is not measured: a long team name shrinks to fit about 17 characters at 22 px (DejaVu Sans, the widest likely font).
const fit = (text, size, chars) => (String(text).length > chars ? Math.floor((size * chars) / String(text).length) : size);
function movement(m, x, y) {
if (m === null) return `<text x="${x}" y="${y + 6}" ${FONT} font-size="13" font-weight="700" fill="#1f6feb">NEW</text>`;
if (m === 0) return `<rect x="${x + 2}" y="${y - 1}" width="12" height="3" fill="#9a9a9a"/>`;
const up = m > 0;
const tri = up ? `${x},${y + 5} ${x + 14},${y + 5} ${x + 7},${y - 6}` : `${x},${y - 6} ${x + 14},${y - 6} ${x + 7},${y + 5}`;
return `<polygon points="${tri}" fill="${up ? '#1a7f37' : '#cf222e'}"/><text x="${x + 18}" y="${y + 5}" ${FONT} font-size="15" fill="${up ? '#1a7f37' : '#cf222e'}">${Math.abs(m)}</text>`;
}
const rungs = rows.map((r, i) => {
const y = TOP + i * RUNG;
const mid = y + RUNG / 2;
const len = Math.max(4, (BAR_W * (r.points || 0)) / maxPoints);
const inside = len > 90;
return (
(i % 2 === 0 ? `<rect x="0" y="${y}" width="${W}" height="${RUNG}" fill="#f6f6f6"/>` : '') +
`<text x="40" y="${mid + 9}" ${FONT} font-size="24" font-weight="700" text-anchor="end" fill="#111111">${r.rank}</text>` +
movement(r.move, 54, mid) +
(r.logo ? `<image href="${esc(r.logo)}" x="100" y="${y + 5}" width="${RUNG - 10}" height="${RUNG - 10}"/>` : '') +
`<text x="146" y="${mid + 8}" ${FONT} font-size="${fit(r.team, 22, 17)}" font-weight="700" fill="#111111">${esc(r.team)}</text>` +
`<text x="${BAR_X - 12}" y="${mid + 7}" ${FONT} font-size="17" text-anchor="end" fill="#555555">${esc(r.record)}${r.first ? ` (${r.first})` : ''}</text>` +
`<rect x="${BAR_X}" y="${y + 7}" width="${len.toFixed(1)}" height="${RUNG - 14}" rx="4" fill="${r.color}" stroke="#00000022"/>` +
`<text x="${inside ? BAR_X + len - 10 : BAR_X + len + 8}" y="${mid + 6}" ${FONT} font-size="16" text-anchor="${inside ? 'end' : 'start'}" fill="${inside ? onColor(r.color) : '#333333'}">${r.points}</text>`
);
});
const svg =
`<svg xmlns="http://www.w3.org/2000/svg" width="${W}" height="${H}" viewBox="0 0 ${W} ${H}">` +
`<rect width="${W}" height="${H}" fill="#ffffff"/>` +
`<text x="0" y="46" ${FONT} font-size="40" font-weight="700" fill="#111111">${esc(POLL)}</text>` +
`<text x="0" y="84" ${FONT} font-size="22" fill="#444444">${esc(week || 'College football')} · bars are poll points, record (first-place votes)</text>` +
rungs.join('') +
`<text x="0" y="${H - 8}" ${FONT} font-size="15" fill="#666666">Data: ESPN via sportsdataverse · colours and logos: sdvplot</text>` +
`</svg>`;
const png = await toPNG(socialCard(svg, { aspect: '4:5', padding: 40, background: '#ffffff' }), {
width: 1080,
images: LIVE ? 'fetch' : 'skip',
});
const out = new URL('./out/', import.meta.url);
mkdirSync(out, { recursive: true });
writeFileSync(new URL('rankings_ladder.png', out), png);
writeFileSync(new URL('rankings_ladder.json', out), `${JSON.stringify({ poll: POLL, week, rows }, null, 2)}\n`);
console.log(`\nwrote out/rankings_ladder.png (${rows.length} teams, ${png.length} bytes) + out/rankings_ladder.json`);
Output
The docs build runs the script offline, against the committed 2024 Week 5 capture. That capture keeps only the rankings, not the page config, so the title line has no week.
Output of node examples/95_rankings_ladder_action.mjs (offline, against the committed fixtures):
## AP Top 25
| rank | move | team | record | points | 1st | colour |
| --- | --- | --- | --- | --- | --- | --- |
| 1 | 0 | Texas | 4-0 | 1527 | 44 | #af5c37 |
| 2 | 0 | Georgia | 3-0 | 1482 | 13 | #ba0c2f |
| 3 | 0 | Ohio State | 3-0 | 1432 | 5 | #ba0c2f |
| 4 | 0 | Alabama | 3-0 | 1328 |  | #9e1b32 |
| 5 | 1 | Tennessee | 4-0 | 1283 |  | #ff8200 |
| 6 | -1 | Ole Miss | 4-0 | 1269 |  | #13294b |
| 7 | 1 | Miami | 4-0 | 1139 |  | #f47423 |
| 8 | 1 | Oregon | 3-0 | 1073 |  | #00934b |
| 9 | 1 | Penn State | 3-0 | 1051 |  | #061440 |
| 10 | 2 | Utah | 4-0 | 1037 |  | #be0000 |
| 11 | -4 | Missouri | 4-0 | 1009 |  | #f1b82d |
| 12 | 6 | Michigan | 3-1 | 805 |  | #00274c |
| 13 | -2 | USC | 2-1 | 690 |  | #9d2235 |
| 14 | 2 | LSU | 3-1 | 637 |  | #461d76 |
| 15 | 4 | Louisville | 3-0 | 553 |  | #c9001f |
| 16 | 1 | Notre Dame | 3-1 | 546 |  | #062340 |
| 17 | 4 | Clemson | 2-1 | 540 |  | #f56600 |
| 18 | 2 | Iowa State | 3-0 | 530 |  | #ae192d |
| 19 | 5 | Illinois | 4-0 | 458 |  | #ff5f05 |
| 20 | -6 | Oklahoma State | 3-1 | 388 |  | #fe5c00 |
| 21 | -6 | Oklahoma | 3-1 | 375 |  | #990000 |
| 22 | new | BYU | 4-0 | 327 |  | #0047ba |
| 23 | -10 | Kansas State | 3-1 | 168 |  | #330a57 |
| 24 | 1 | Texas A&M | 3-1 | 77 |  | #500000 |
| 25 | new | Boise State | 2-1 | 69 |  | #0033a0 |

wrote out/rankings_ladder.png (25 teams, 118321 bytes) + out/rankings_ladder.json
Run it every week with GitHub Actions
Like the scores card's, this workflow is a template in
examples/workflows/rankings-ladder.yml
that never runs in this repo. Turning it on works the same way as the
scores card's: save the
script as scripts/rankings-ladder.mjs and the workflow as
.github/workflows/rankings-ladder.yml on your default branch, then try
Run workflow. No secrets are needed.
# Weekly power-rankings ladder: a template for YOUR repository
# (it is not active in sportsdataverse-js). Copy it to
# .github/workflows/rankings-ladder.yml, and examples/95_rankings_ladder_action.mjs
# to scripts/rankings-ladder.mjs. No secrets needed. Tutorial:
# https://js.sportsdataverse.org/docs/tutorials/sdvplot-rankings-ladder
name: Weekly rankings ladder

on:
  schedule:
    # Tuesdays 14:00 UTC (10:00 EDT / 09:00 EST), January and August-December:
    # the AP poll comes out on Sunday; off-season, ESPN keeps serving the last one.
    - cron: '0 14 * 1,8-12 2'
  workflow_dispatch:
    inputs:
      poll:
        description: 'Poll name, e.g. AP Top 25 or AFCA Coaches Poll'
        default: AP Top 25
      season:
        description: 'Season year for a past poll; empty means the current one'
        default: ''
      week:
        description: 'Regular-season week for a past poll; empty means the current one'
        default: ''

permissions:
  contents: read

jobs:
  ladder:
    runs-on: ubuntu-latest
    timeout-minutes: 10
    steps:
      - uses: actions/checkout@fbc6f3992d24b796d5a048ff273f7fcc4a7b6c09 # v5.1.0
      - uses: actions/setup-node@a0853c24544627f65ddf259abe73b1d18a591444 # v5.0.0
        with:
          node-version: 22
      # resvg finds fonts through fontconfig; with none it draws no text at all
      - name: Make sure a text font is installed
        run: |
          fc-list | grep -qi dejavu || {
            sudo apt-get update -q
            sudo apt-get install -y -q fontconfig fonts-dejavu-core
          }
      - name: Install sportsdataverse, sdvplot and the resvg rasterizer
        run: >-
          npm install --no-save --no-package-lock
          sportsdataverse@^4.0.0
          @sportsdataverse/sdvplot@^0.1.0
          @resvg/resvg-js@^2.6.2
      - name: Render the ladder
        env:
          SDV_LIVE: '1' # real ESPN + logo CDN (the docs build runs it offline)
          POLL: ${{ inputs.poll || 'AP Top 25' }}
          SEASON: ${{ inputs.season }}
          WEEK: ${{ inputs.week }}
        run: node scripts/rankings-ladder.mjs
      - uses: actions/upload-artifact@ea165f8d65b6e75b540449e92b4886f43607fa02 # v4.6.2
        with:
          name: rankings-ladder-${{ github.run_id }}
          path: scripts/out/
          if-no-files-found: error
          retention-days: 30
The schedule. The fields of '0 14 * 1,8-12 2' are minute 0, hour 14,
any day of the month, the months January and August to December, and
day-of-week 2 (Tuesday). When both day fields are restricted, cron runs if
either matches. Here day-of-month is *, so only Tuesday counts. As with
every Actions schedule, the hour is UTC with no daylight saving: 14:00 UTC is
10:00 EDT in the fall and 09:00 EST after the clocks change. The months skip
the off-season, when ESPN keeps serving the final poll, which would only
repeat the same image. Adjust them for your sport.
What was verified
- The ladder above is a live run on 2026-10-08.
- The workflow's steps were repeated on Linux (Ubuntu 22.04, Node 22) in an
empty directory: install from local tarballs (the packages aren't on npm
yet), then
SDV_LIVE=1 POLL='AP Top 25' SEASON= WEEK= node scripts/rankings-ladder.mjs. It wrote the same ladder. actionlint(with shellcheck) passes on the workflow.- It has not run on GitHub's own runners, which needs the npm publish.
Next
- Nightly scores card: the daily twin, with the full notes on fonts, schedules and posting.
- Tiered rankings and logo axes (
teamTiers,axisLogos) for Observable Plot are in sdvplot's docs at plot.sportsdataverse.org.