A player's form from his game log
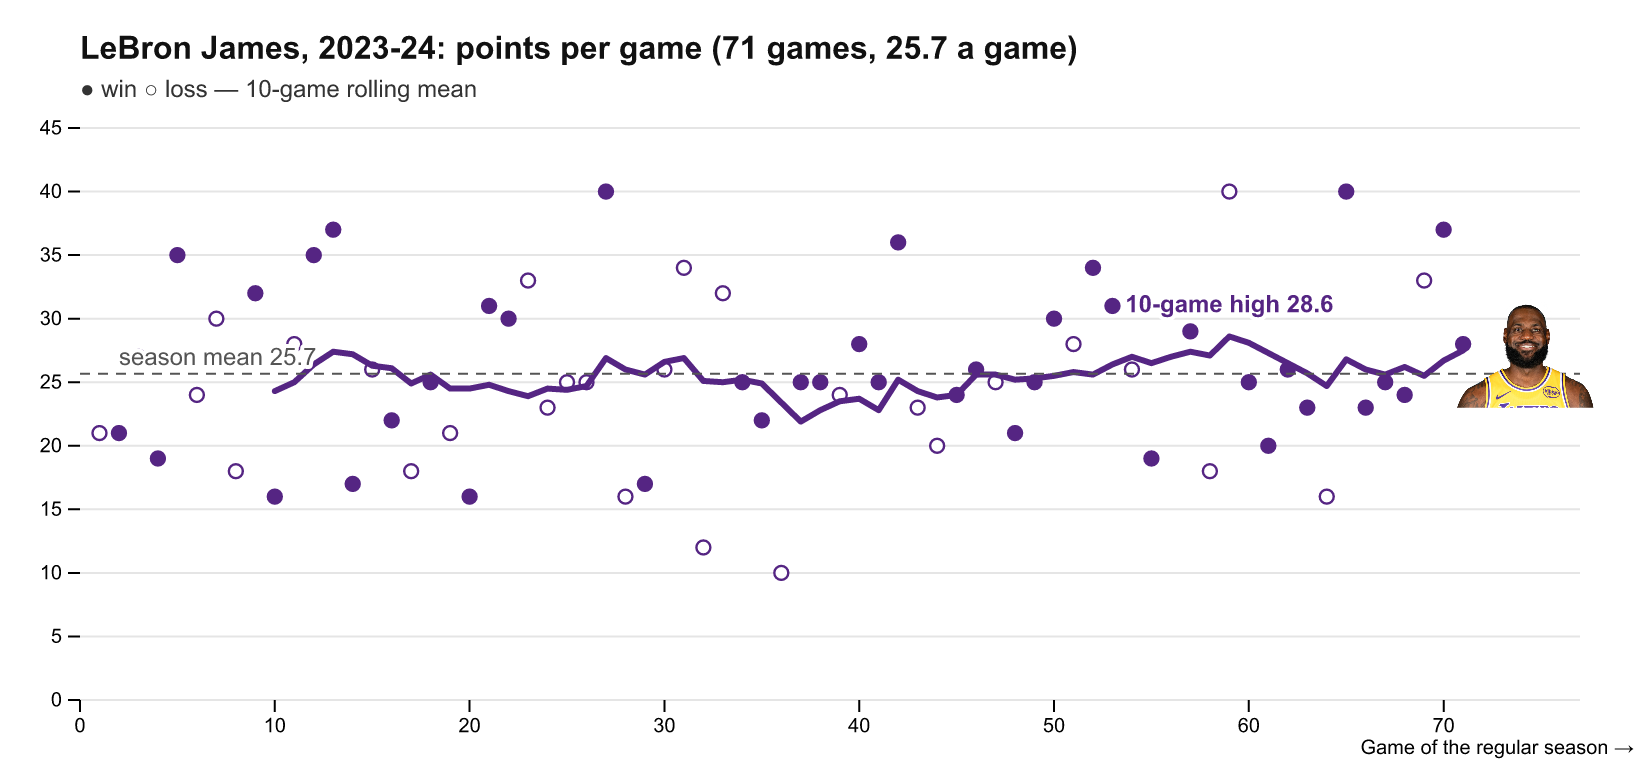
What you'll build: a season of form for one player: his points in every
game (filled for a win, hollow for a loss), a 10-game rolling mean in his
team's colour, the season mean as a dashed line, and his headshot at the end of
the line. The script also prints his official per-game line. Written to
examples/out/lebron_2024_form.png.
Needs sportsdataverse ≥ 4.0.0 and @sportsdataverse/* ≥ 0.1.0. Neither is on
npm yet, so build both from source: see the shot chart
tutorial for linking
sdvplot-js.
Sources used
| Source | Host | Call |
|---|---|---|
| ESPN web v3 | site.web.api.espn.com/apis/common/v3/sports/basketball/nba/athletes/1966/gamelog?season=2024 | sdv.nba.espnNbaPlayerGamelog({ athlete_id: '1966', season: 2024 }) |
@sportsdataverse/sdvplot | (library; the headshot is fetched by toPNG) | teamColors; /plot: meanLines, headshots; /export: toPNG |
Offline fixture: test/fixtures/espn/athlete_gamelog_nba_1966_2024.json.gz, the
verbatim response captured on 2026-10-08 (787 KB, 25 KB gzipped).
test/tutorial-fixtures.test.js checks its sha256 and re-derives the season
below from it. The script also needs @observablehq/plot and jsdom, which
examples/_resolve.mjs takes from the sdvplot-js checkout.
Three parts, one row per game
The game log keeps what you need in three places:
names: the stat names, in column order (minutes, …points).seasonTypes[].categories[].events[]: one entry per game, with aneventIdand astatsarray in that order. In the regular season the categories are months, so its 73 games are spread over seven of them.events: the game details (date, opponent, home or away, result, score, the player's team, and aneventNotefor special games), keyed by event id.
The script takes the payload raw and joins the three itself: each game's stats
by name, then its details by eventId. It first checks that every eventId is
a string, the type of the keys it is looked up in, and it throws if an event
has stats but no details.
{ parsed: true } does not help here yet. The athlete_gamelog parser, a
faithful port of sdv-py's, reads stat names and game details from each
category. ESPN's response has them at the top level, so on this payload the
parser returns stat_0 … stat_13 with no date or opponent. The fix belongs in
sdv-py first and then here.
ESPN's gameDate is in UTC, so a 7:30 pm Eastern tip-off is dated the next
day. The script converts it to the US Eastern date.
Which games count
The "2023-24 Regular Season" block lists 73 games. Two of them do not count in the official season statistics:
- the All-Star Game (18 February 2024), and
- the In-Season Tournament championship (9 December 2023), the one tournament game the NBA keeps out of the regular-season record.
Both carry an eventNote, so the script drops them by name. What remains is
71 games and 1,822 points: 25.7 points, 7.3 rebounds and 8.3 assists in 35.3
minutes a game, LeBron's official 2023-24 line. Counting all 73 would have
given 1,854 points and 25.4 a game. The play-in game against New Orleans is in
its own 2023-24 Play In Regular Season block, which the script leaves out.
The chart
The rolling mean starts at game 10, the first game with 10 behind it. The
script makes the chart in a single Plot.plot in Node with a jsdom document:
Plot.dotfor each game, filled for a win.Plot.linefor the rolling mean, in the Lakers' primary colour fromteamColors('nba', ['13']). The team id comes from the game log, and the script checks that the season has only one.- sdvplot's
meanLines(season, { y: 'pts' })for the season mean. headshotsplaces the player's ESPN headshot by athlete id.
toPNG downloads the headshot (the one network call it makes) and rasterises
the SVG with resvg. The plot has no Plot title, because that wraps the SVG in
an HTML <figure> and toPNG takes SVG. The heading is a text mark in the top
margin.
The script
// 97 — A player's form: an ESPN game log → points per game with a rolling
// average, the season mean and the player's headshot → PNG.
//
// Shows: `espnNbaPlayerGamelog({ athlete_id: '1966', season: 2024 })` (LeBron
// James, 2023-24; ESPN web v3) taken RAW and joined by hand: the payload keeps the
// stat names (`names`), the per-game stats (`seasonTypes[].categories[].events[]`)
// and the game details (`events`, keyed by event id) in three places. Then the
// official regular season (ESPN files two games there that do not count), a
// 10-game rolling mean, and a chart drawn with Observable Plot in Node (jsdom):
// `teamColors` for the line, sdvplot's `meanLines` for the season average,
// `headshots` at the end of the line, `toPNG` (resvg, which downloads the
// headshot). Writes examples/out/lebron_2024_form.png. sdvplot-js is UNPUBLISHED.
//
// Sources: ESPN web v3 — site.web.api.espn.com/apis/common/v3/sports/basketball/nba/athletes/1966/gamelog?season=2024
// Offline fixture: test/fixtures/espn/athlete_gamelog_nba_1966_2024.json.gz (verbatim, captured 2026-10-08).

import { mkdirSync, writeFileSync } from 'node:fs';
import * as Plot from '@observablehq/plot';
import { JSDOM } from 'jsdom';
import sdv from 'sportsdataverse';
import { teamColors } from '@sportsdataverse/sdvplot';
import { toPNG } from '@sportsdataverse/sdvplot/export';
import { headshots, meanLines } from '@sportsdataverse/sdvplot/plot';
import { setup } from './_offline.mjs';
import { printTable, round } from './_util.mjs';

setup();

const ATHLETE_ID = '1966';
const WINDOW = 10;
const FONT = 'Arial, Helvetica, sans-serif'; // resvg draws text with the system's fonts; Plot's default system-ui resolves oddly there

const raw = await sdv.nba.espnNbaPlayerGamelog({ athlete_id: ATHLETE_ID, season: 2024 });

// --- join the three parts of the payload ---------------------------------------------
const col = Object.fromEntries(raw.names.map((n, i) => [n, i])); // 'points' → 13, …
const block = raw.seasonTypes.find((s) => / Regular Season$/.test(s.displayName) && !/Play In/.test(s.displayName));
const logged = block.categories.filter((c) => c.type === 'event').flatMap((c) => c.events);
// The join key: a game's eventId and the keys of `events` must agree in type (object keys are strings).
const keyTypes = new Set(logged.map((e) => typeof e.eventId));
if (keyTypes.size !== 1 || !keyTypes.has('string')) throw new Error(`eventId types: ${[...keyTypes]}`);
const games = logged.map((e) => {
  const g = raw.events[e.eventId];
  if (!g) throw new Error(`event ${e.eventId} has stats but no game details`);
  return {
    event_id: e.eventId,
    date: new Date(g.gameDate).toLocaleDateString('en-CA', { timeZone: 'America/New_York' }), // gameDate is UTC: an evening tip-off is the next day there
    opp: g.opponent.abbreviation,
    at_vs: g.atVs,
    result: g.gameResult,
    score: g.score,
    team_id: g.team.id,
    note: g.eventNote ?? '',
    min: Number(e.stats[col.minutes]),
    pts: Number(e.stats[col.points]),
    reb: Number(e.stats[col.totalRebounds]),
    ast: Number(e.stats[col.assists]),
  };
});

// ESPN's "Regular Season" block also holds the All-Star Game and the In-Season
// Tournament final, neither of which counts in the official season statistics.
const extra = games.filter((g) => /All-Star Game|In-Season Tournament Championship/.test(g.note));
const season = games.filter((g) => !extra.includes(g)).sort((a, b) => a.date.localeCompare(b.date));
season.forEach((g, i) => {
  g.game = i + 1;
  const win = season.slice(Math.max(0, i - WINDOW + 1), i + 1);
  g.pts_roll = win.length === WINDOW ? win.reduce((s, x) => s + x.pts, 0) / WINDOW : null;
});

const per = (k) => round(season.reduce((s, g) => s + g[k], 0) / season.length, 1);
const totals = { games: season.length, pts: season.reduce((s, g) => s + g.pts, 0), ppg: per('pts'), rpg: per('reb'), apg: per('ast'), mpg: per('min') };

// --- the chart -----------------------------------------------------------------------
const doc = new JSDOM('').window.document;
const teamIds = [...new Set(season.map((g) => g.team_id))];
if (teamIds.length !== 1) throw new Error(`more than one team in the season: ${teamIds}`);
const [lal] = await teamColors('nba', teamIds, { which: 'primary' });
const last = season.at(-1);
const peak = season.filter((g) => g.pts_roll != null).reduce((a, b) => (b.pts_roll > a.pts_roll ? b : a));
const chart = Plot.plot({
  document: doc,
  style: { fontFamily: FONT, background: 'white' },
  width: 820,
  height: 380,
  marginTop: 64,
  marginRight: 30,
  // no Plot `title`: it wraps the SVG in an HTML <figure>, and toPNG takes an SVG; the heading is a text mark
  x: { label: 'Game of the regular season →', domain: [0, season.length + 6] },
  y: { label: null, domain: [0, 45], grid: true },
  marks: [
    Plot.dot(season, { x: 'game', y: 'pts', r: 3.5, fill: (g) => (g.result === 'W' ? lal : 'white'), stroke: lal, strokeWidth: 1.2 }),
    Plot.line(season, { x: 'game', y: 'pts_roll', stroke: lal, strokeWidth: 3 }),
    ...meanLines(season, { y: 'pts', stroke: '#555', strokeDasharray: '5 4' }),
    Plot.text([totals.ppg], { x: 2, y: (d) => d, text: (d) => `season mean ${d}`, dy: -8, textAnchor: 'start', fill: '#555', stroke: 'white', strokeWidth: 4, fontSize: 12 }),
    Plot.text([peak], { x: 'game', y: 'pts_roll', text: (g) => `${WINDOW}-game high ${round(g.pts_roll, 1)}`, dy: -16, fill: lal, stroke: 'white', strokeWidth: 4, fontSize: 12, fontWeight: 'bold' }),
    Plot.text([{}], { frameAnchor: 'top-left', dy: -46, text: () => `LeBron James, 2023-24: points per game (${totals.games} games, ${totals.ppg} a game)`, fontSize: 16, fontWeight: 'bold', fill: '#111', textAnchor: 'start' }),
    Plot.text([{}], { frameAnchor: 'top-left', dy: -24, text: () => `● win  ○ loss  — ${WINDOW}-game rolling mean`, fontSize: 12, fill: '#333', textAnchor: 'start' }),
    headshots([last], { league: 'nba', player: () => ATHLETE_ID, x: () => season.length + 3.2, y: 'pts_roll', height: 0.2 }),
  ],
});
mkdirSync(new URL('./out/', import.meta.url), { recursive: true });
writeFileSync(new URL('./out/lebron_2024_form.png', import.meta.url), await toPNG(chart, { scale: 2 }));

printTable([totals], ['games', 'pts', 'ppg', 'rpg', 'apg', 'mpg'], 1, `Regular season (ESPN listed ${games.length} games; ${extra.length} do not count)`);
printTable(extra, ['date', 'opp', 'note', 'pts'], 2, 'Logged under Regular Season but not counted');
printTable(
  season.filter((g) => g.game % 10 === 0 || g === peak || g === last).map((g) => ({ ...g, pts_roll: round(g.pts_roll, 1) })),
  ['game', 'date', 'opp', 'at_vs', 'result', 'pts', 'pts_roll'],
  12,
  `Every 10th game, the peak and the last → examples/out/lebron_2024_form.png`
);
This script imports the unpublished @sportsdataverse/* packages, and toPNG
needs the native @resvg/resvg-js, which a WebContainer cannot load. Build
sdvplot-js locally and run it from examples/.
Output
Output of node examples/97_sdvplot_player_gamelog.mjs (offline, against the committed fixtures):
## Regular season (ESPN listed 73 games; 2 do not count)
| games | pts  | ppg  | rpg | apg | mpg  |
| ----- | ---- | ---- | --- | --- | ---- |
| 71    | 1822 | 25.7 | 7.3 | 8.3 | 35.3 |
(1 rows, all shown)

## Logged under Regular Season but not counted
| date       | opp  | note                       | pts |
| ---------- | ---- | -------------------------- | --- |
| 2024-02-18 | EAST | NBA All-Star Game          | 8   |
| 2023-12-09 | IND  | NBA In-Season Tournament … | 24  |
(2 rows, all shown)

## Every 10th game, the peak and the last → examples/out/lebron_2024_form.png
| game | date       | opp | at_vs | result | pts | pts_roll |
| ---- | ---------- | --- | ----- | ------ | --- | -------- |
| 10   | 2023-11-14 | MEM | vs    | W      | 16  | 24.3     |
| 20   | 2023-12-02 | HOU | vs    | W      | 16  | 24.5     |
| 30   | 2023-12-30 | MIN | @     | L      | 26  | 26.6     |
| 40   | 2024-01-21 | POR | vs    | W      | 28  | 23.7     |
| 50   | 2024-02-23 | SA  | vs    | W      | 30  | 25.5     |
| 59   | 2024-03-16 | GS  | vs    | L      | 40  | 28.6     |
| 60   | 2024-03-18 | ATL | vs    | W      | 25  | 28.1     |
| 70   | 2024-04-12 | MEM | @     | W      | 37  | 26.7     |
| 71   | 2024-04-14 | NO  | @     | W      | 28  | 27.5     |
(9 rows, all shown)
What it shows
The season mean of 25.7 hides the shape of the season. The rolling mean held between 24 and 27.4 through November and December, then fell to 21.9 in mid-January. After the All-Star break it climbed to its peak: 28.6 over the 10 games to the 16 March home loss to Golden State, in which he scored 40. It dipped to 24.7 in late March and finished the season at 27.5. Losses (hollow dots) run from 10 points to 40, so his points alone do not separate the Lakers' wins from their losses.
Variations
- Another player: any ESPN athlete id; the headshot follows the id.
- Another stat:
rebounds/assistsare columns of the same join (raw.nameslists all fourteen). - The playoffs: the
2023-24 Postseasonblock has the same shape. - Another window: change
WINDOW. A shorter window follows the hot and cold runs; a longer one shows the trend.
Work through it live
- sdvplot-js marks guide
(
headshots,logos,meanLines) and the Observable Plot guide. - Rendering in Node and exporting PNGs.
- The sdvplot-js notebooks, in particular logos and headshots.
Next steps
- A game's shot chart against the league: the shot kit on one NBA game.
- NFL standings as a publication table: sdvtables to PNG.